
Measuring Canada Against the World

A purpose-built benchmarking tool measuring how Canada finances, builds, governs, secures, and elevates the nation — compared against international peers.

Benchmarking is a standard tool in business: organizations routinely measure their performance against industry peers and best-in-class competitors to see where they lead, where they lag, and where to focus. This tool applies that same discipline to a country.

It organizes Canada's national performance against international peers across five pillars of nation building. Each pillar answers a different question about the state of the country, and each is tracked through specific, comparable metrics.

The pillars are ordered, not arbitrary: each one is the foundation for the next, so together they trace a single line of cause and effect — what a country must get right first, and what each success makes possible. Read in that order:

We finance to build, we build to govern well, we govern well to secure the nation, and we secure it to elevate the lives of our people.
State of the Nation

Canada at a glance

Each metric tracked on this site is benchmarked against an international peer set — typically the G7 or a comparable group of OECD economies. The verdict below reflects where Canada currently sits in that comparison: strong if in the top third, watch in the middle, weak in the bottom.

View by
Financing
Watch
Building
Weak
Governing
Weak
Securing
Weak
Elevating
Weak

Pillar verdicts above recompute from the currently visible metrics. Pillars with no visible metrics under the chosen view are dimmed.

Financing Can we afford to build?
  • Instalment loans 2.64% (≈3× since 2015) · auto & cards at series highs · all three rising · BoC/TransUnion Open the full analysis →
  • $53.4B 2024-25 · now exceeds CHT · +162% since 2020-21 Open the full analysis →
  • 112.5% · rank 3 of 7 G7 · 2026 IMF projection Open the full analysis →
  • Upstream oil & gas capex collapsed to ~$21B (2020), recovered to ~$43B (2024) but still ~half its 2014 peak (~$81B) · oil sands −58% · capital didn't rotate: business investment/worker −16% vs US +26% Open the full analysis →
  • 1.2% of GDP 2024-25 · 2nd-smallest in G7 · primary balance back in surplus Open the full analysis →
  • ~14.4% household DSR · highest in G7 · near 2023 peak · financial stress 2.16%, near 2019 high Open the full analysis →
  • 173% of disposable income · rank 7 of 7 G7 · Q4 2025 Open the full analysis →
  • World's #1 exploration destination 5 yrs running · ~19% of global budget (US$2.3B 2025) · but global pool shrinking 3 yrs & grassroots discovery at all-time-low 21% Open the full analysis →
  • 0.28% · 2nd-lowest in G7 · doubled since 2022 Open the full analysis →
  • Top 1% pays 22.1% of income tax on 10.1% of income (2.19×) · burden ratio above the US (1.86×) & near a 40-year peak · top 5% pay as much as the bottom 90% · bottom half 5.0% · 28.5% of filers owe none Open the full analysis →
Building Can we still build?
  • Broad, world-class endowment · #1 potash & #2 uranium producer · but mines <2% of world supply in lithium/graphite/cobalt despite 2–4% of reserves · 0 t rare earths on >14 Mt resources Open the full analysis →
  • 82% clean · 2nd in G7 · need >10 GW/yr clean to 2050 vs ~1.5 recent · 21 GW data-centre queue Open the full analysis →
  • 1,550 new postdocs 2024 · <½ of 2019 · 0.3% of work permits · 10-yr PR 28%→22% Open the full analysis →
  • 44% of recent immigrants in jobs matching their training · ~$50B foregone GDP · same-profession assessment in weeks (nursing ~6, vs ~7 AU / ~10 UK) but licensure ~2 yrs · no national standard, hundreds of regulators Open the full analysis →
  • $60–90M/km envelope · pre-construction Open the full analysis →
  • Most immigrant-heavy G7 economy (22.2%) yet last in G7 for GDP/capita (+1.8% decade) · growth went to headcount, not households · 2023 surge temporary, reversed 2024/25 Open the full analysis →
  • 18 triadic patents/M · 6th of 7 · −$298/capita net IP deficit · 45% of inventions owned abroad Open the full analysis →
  • Eglinton $662M/km · ~9× Seoul Sillim Line Open the full analysis →
  • ~27 yrs discovery→production · 3rd-slowest of major jurisdictions · Australia +7 yr faster · #1 in exploration spend Open the full analysis →
  • TMX $34.9M/km · 6.3× FID cost overrun Open the full analysis →
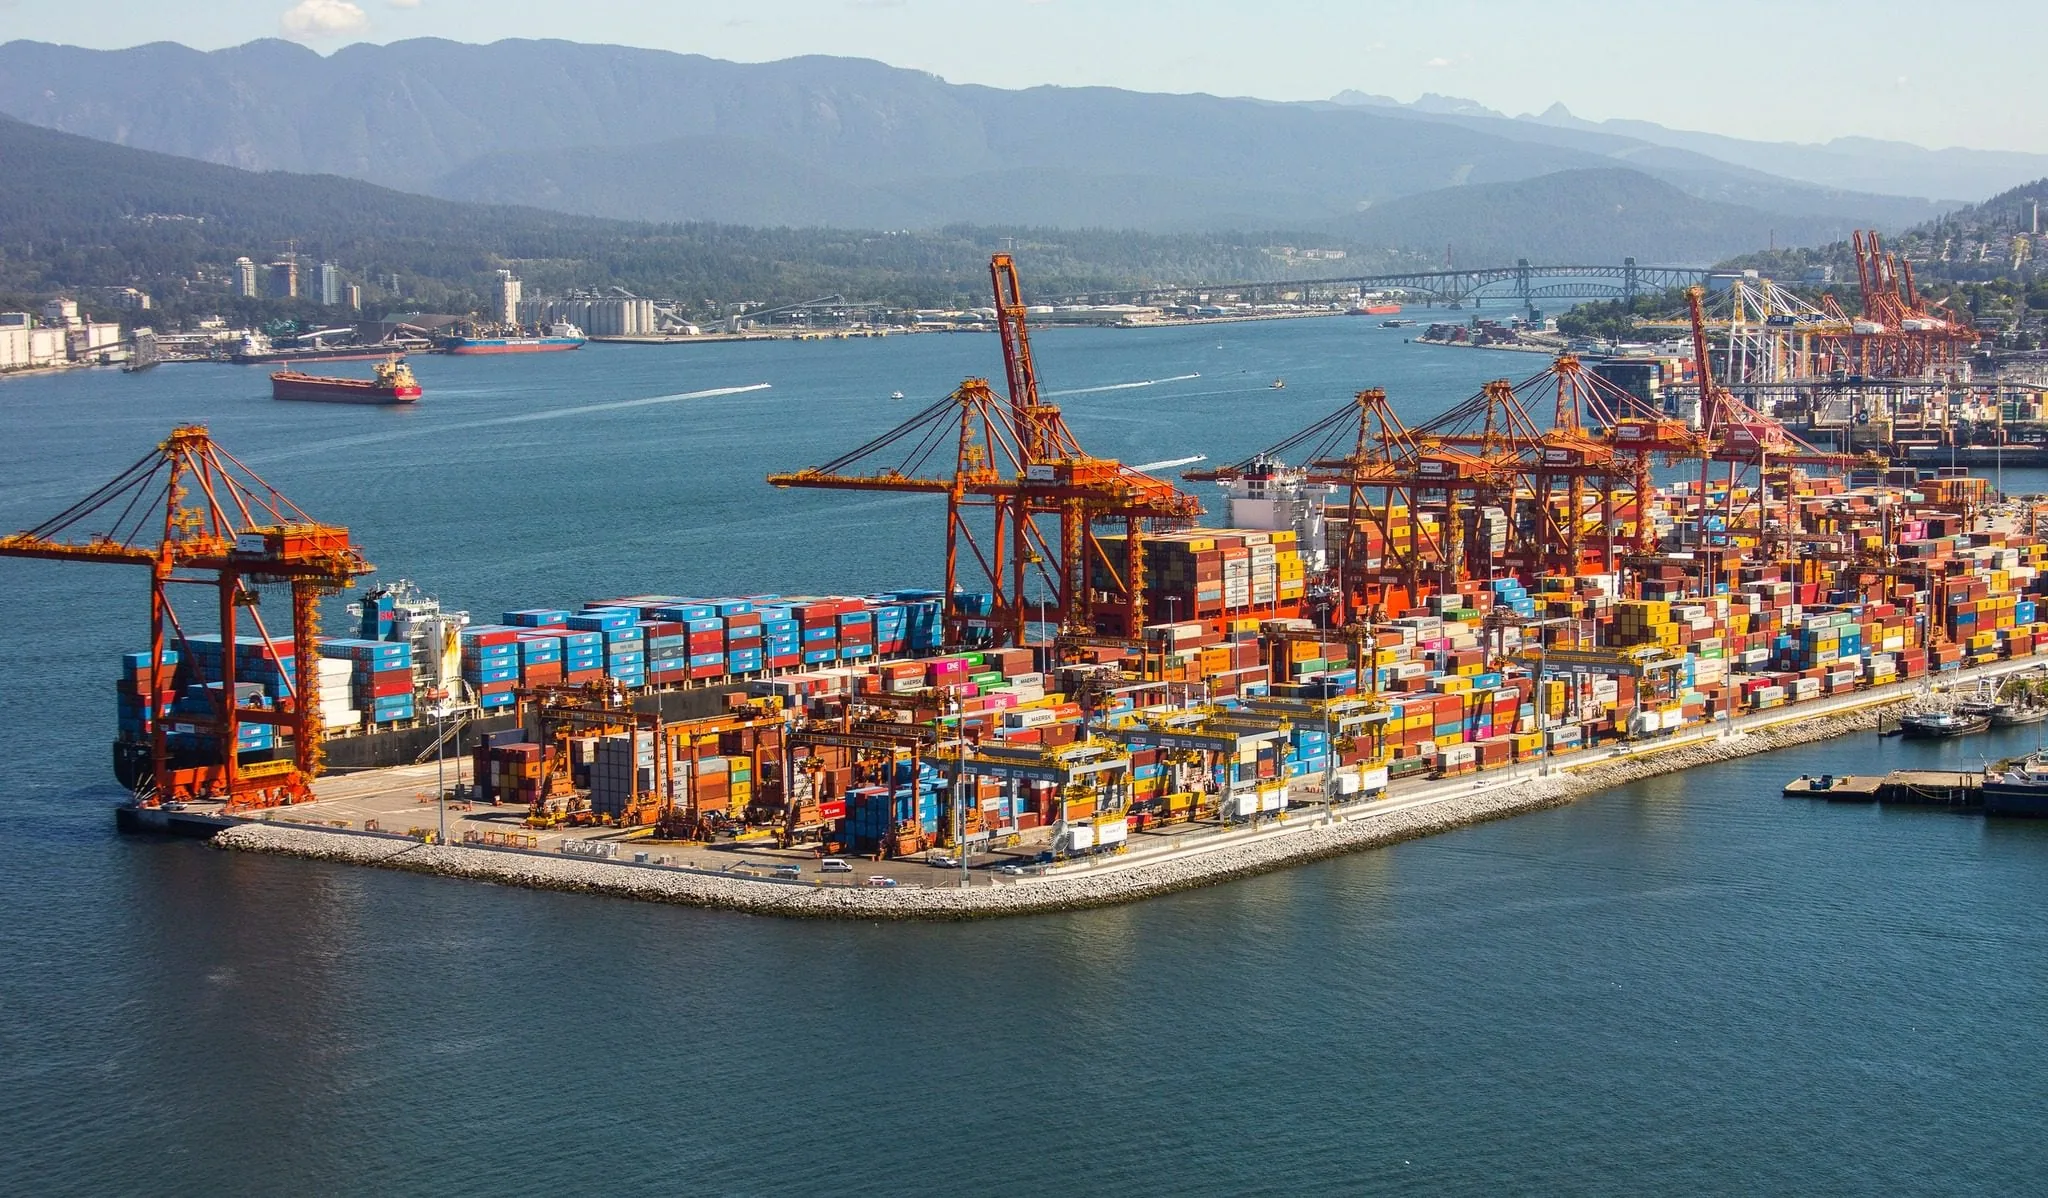
  • Global rank for port capacity fell 6th→23rd (2016-23) · only G7 economy besides US to lose capacity · Vancouver port network centrality −79% Open the full analysis →
  • US 45× Canada (2024) · ~50% of Canadian founders abroad · v0.1 Open the full analysis →
  • Top-university STEM grads 83.5% vs 91.1% retained (yr 3) · doctoral lowest · 34% of PhD immigrants leave Open the full analysis →
  • USD 136/person 2025 · rank 4 of 4 · US 7.4× · Israel 11.5× Open the full analysis →
Governing Does government deliver?
  • Just 46.8% of requests (excl. immigration) meet the 30-day legal deadline · disclosure at record-low 73.8% · two statutory reviews, no reform Open the full analysis →
  • WJP “no unreasonable delay” 0.42/1.00 (worst subfactor) · civil justice 25th of 142 vs 12th overall · ~10,000 criminal cases/yr stayed for delay Open the full analysis →
  • 31 min average · rank 4 of 4 · 5% answered within 15-min target Open the full analysis →
  • 28.6 wks GP→treatment 2025 · rank 9 of 9 on surgical waits · 2nd-longest ever Open the full analysis →
  • 935,000 applications in backlog (43%) · 7 of 13 lines met IRCC’s 80% target · citizenship 13 mo, visitor extensions 314 days Open the full analysis →
  • ~$210B / 7% GDP gain forgone · 9% avg internal tariff-equiv · >40% in health & education Open the full analysis →
  • 99% met the 10/20-day standard in 2025-26 (target 90%) · but 70% in 2022-23 & 78% in 2024-25 · “30 days or it’s free” guarantee live Apr 2026 Open the full analysis →
  • CBC funded at CAD $31.71/capita, lowest of 5 peers vs Germany $165.53 & UK $104.72 · trust in news 37%, matches global avg · CBC Radio reach 84%→67% Open the full analysis →
  • +43.0% federal headcount 2014–2024 · rank 1 of 7 G7 growth · 20.7% all-gov share Open the full analysis →
  • ~7.2 mo wait to examination · slowest of 8 offices · peak ~56 mo Feb 2024 Open the full analysis →
  • 47% of first applications decided within the 16-week standard in 2024-25 (down from 69%) · backlog over 11,000, ~double a year earlier Open the full analysis →
Securing Can we defend ourselves?
  • Temp residents 3.6%→7.6% of population in 3yrs (govt capped at <5%) · no published overstay rate (US publishes) · 34,700 under removal orders untraced (2019) Open the full analysis →
  • 0.6 charged/M vs UK 3.6 arrested/M · charges +488% (FY23–24) · GTI can't see foiled plots Open the full analysis →
  • China refines 60–94% of battery & magnet materials (94% magnets, >99% graphite anode) · Canada has the rock but near-zero midstream · first REE plant (SRC) ~400 t/yr, ≈0.1% of China Open the full analysis →
  • Cocaine seizures ~2.4× since FY19 (1,429→3,479 kg) · firearms persistent · import/export offences rose 3→24/100k as overall drug crime fell Open the full analysis →
  • 2.01% 2025e · rank 22 of 30 NATO · below 2.76% alliance avg · met 2% first time Open the full analysis →
  • 22.6% on equipment 2025e · rank 27 of 29 NATO · met 20% guideline first time · Poland 54% Open the full analysis →
  • One BC superlab = 95.5M lethal doses (~2.3× population) · Canada now producer/exporter, not importer · 40 fentanyl-production sites dismantled 2018–23 Open the full analysis →
  • 608 incidents 2024, ~3× since 2014 · 93% of victims women/girls · 75% domestic, not cross-border · ~10% of court cases end in a guilty finding Open the full analysis →
  • Real teeth now — 3 Chinese firms ordered out of critical-mineral juniors (2022), extended NS reviews 11→30/yr · but modernised last of Five Eyes (Bill C-34, 2024) on a short, contested record Open the full analysis →
  • 1.88 per 1,000 pop · rank 29 of 31 NATO · 10th by headcount · last in G7 Open the full analysis →
  • Basel risk 4.47/10 · below 5.30 global avg · but FSI 18th of 141 secrecy enablers Open the full analysis →
  • CBSA interceptions ~5× since 2018 (peak 2,277 in 2024, 1,590 in 2025) · thefts −18.6% from 2023 record 70,475 · ~$1B claims · past peak, still elevated Open the full analysis →
Elevating Are our citizens flourishing? — the outcomes all the other work exists to produce
  • 30.8% of 0–5s not in care on a waitlist (2025) · up from 19.1% (2022) · infants under 1 at 56.5% · StatCan 42-10-0106-01 Open the full analysis →
  • 1 CAD = US$0.71 · −17.5% vs USD since 2015 · petro-currency link broken; no lift from 2026 Hormuz shock Open the full analysis →
  • US$0.123/kWh residential · cheapest in G7 · ~$1,370/yr bill mid-pack (high usage) Open the full analysis →
  • ~19% food insecurity · rank 6 of 7 G7 · visits doubled since 2019 Open the full analysis →
  • ≈C$1.70/L regular · 2nd-cheapest of 7 oil-producing democracies · June 2026 avg Open the full analysis →
  • +1.1% real per capita 2014–2024 · last of 7 G7 · ~85% of GDP growth was population Open the full analysis →
  • 4,882 incidents 2024 · rate +258% since 2015 · rank 6 of 7 G7 trajectory Open the full analysis →
  • National MPPI 52.3% of income (Q1 2026) · +11.7pp above 25-yr norm of 40.6% · 66.5 months to save a down payment Open the full analysis →
  • 20.9% of households over 30% of income on shelter (2021) · renters 33% vs owners 15% · OECD 40% overburden 8% ≈ EU avg Open the full analysis →

How to read this. Each metric is scored against its own peer set: top third = strong, middle = watch, bottom = weak, with direction adjusted so "less debt" or "shorter waits" count as strong. Pillar verdicts reflect the balance of contributing metrics. Click a metric to see its figures, then Open the full analysis for the underlying page.

Financing the Nation

Can we afford to build?

Balance-sheet capacity, public and household — whether the government has fiscal room to finance ambition, and whether households can service the debt they already carry. We read affordability from both sides of the ledger: the sovereign's debt burden and the cost of carrying it, set against the leverage and repayment stress sitting on household balance sheets, because the capacity to build rests on both staying sound.
Building the Nation

Can we still build?

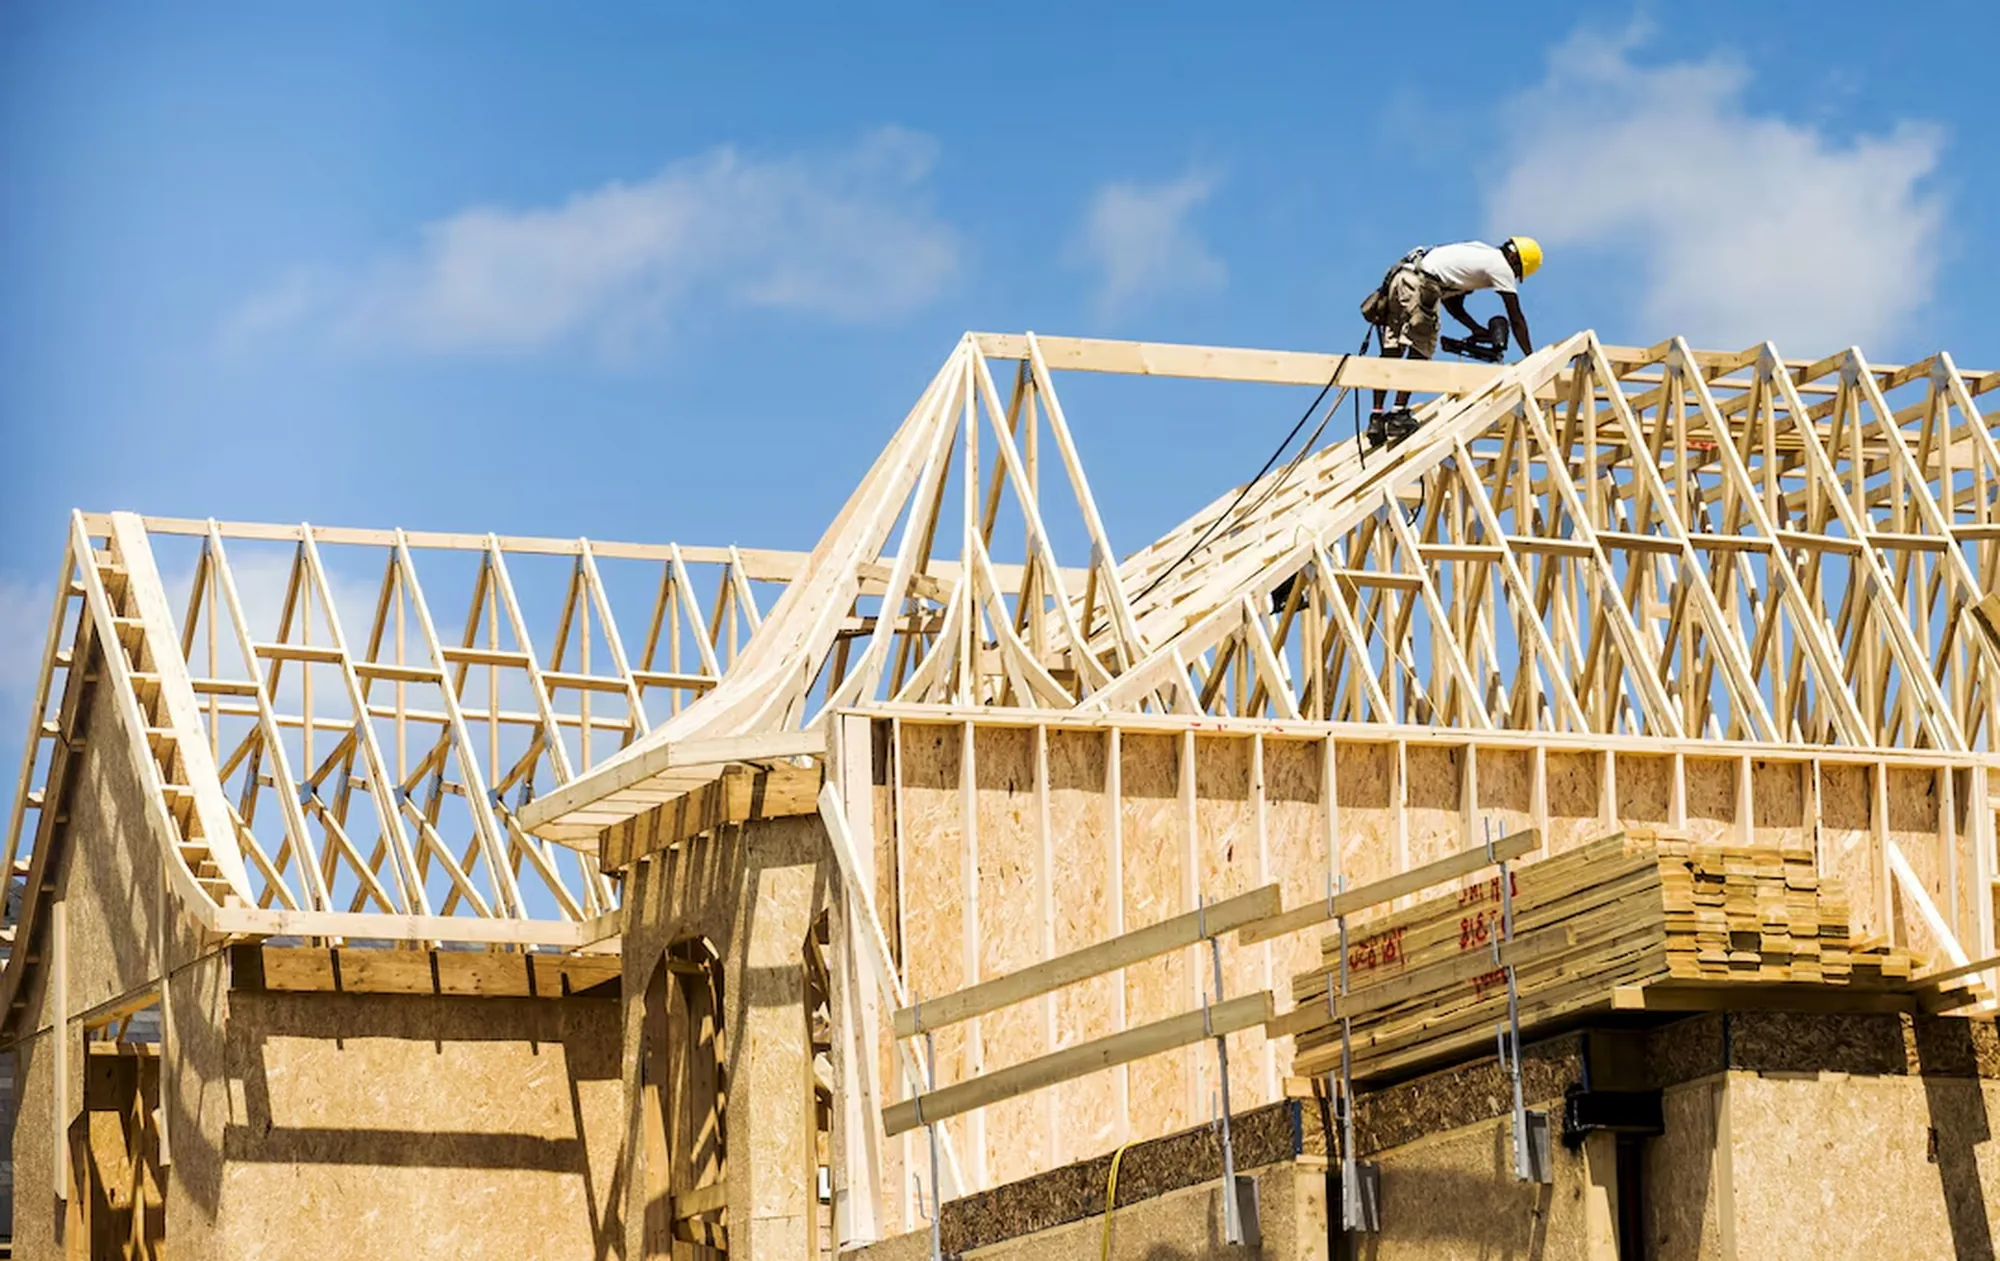
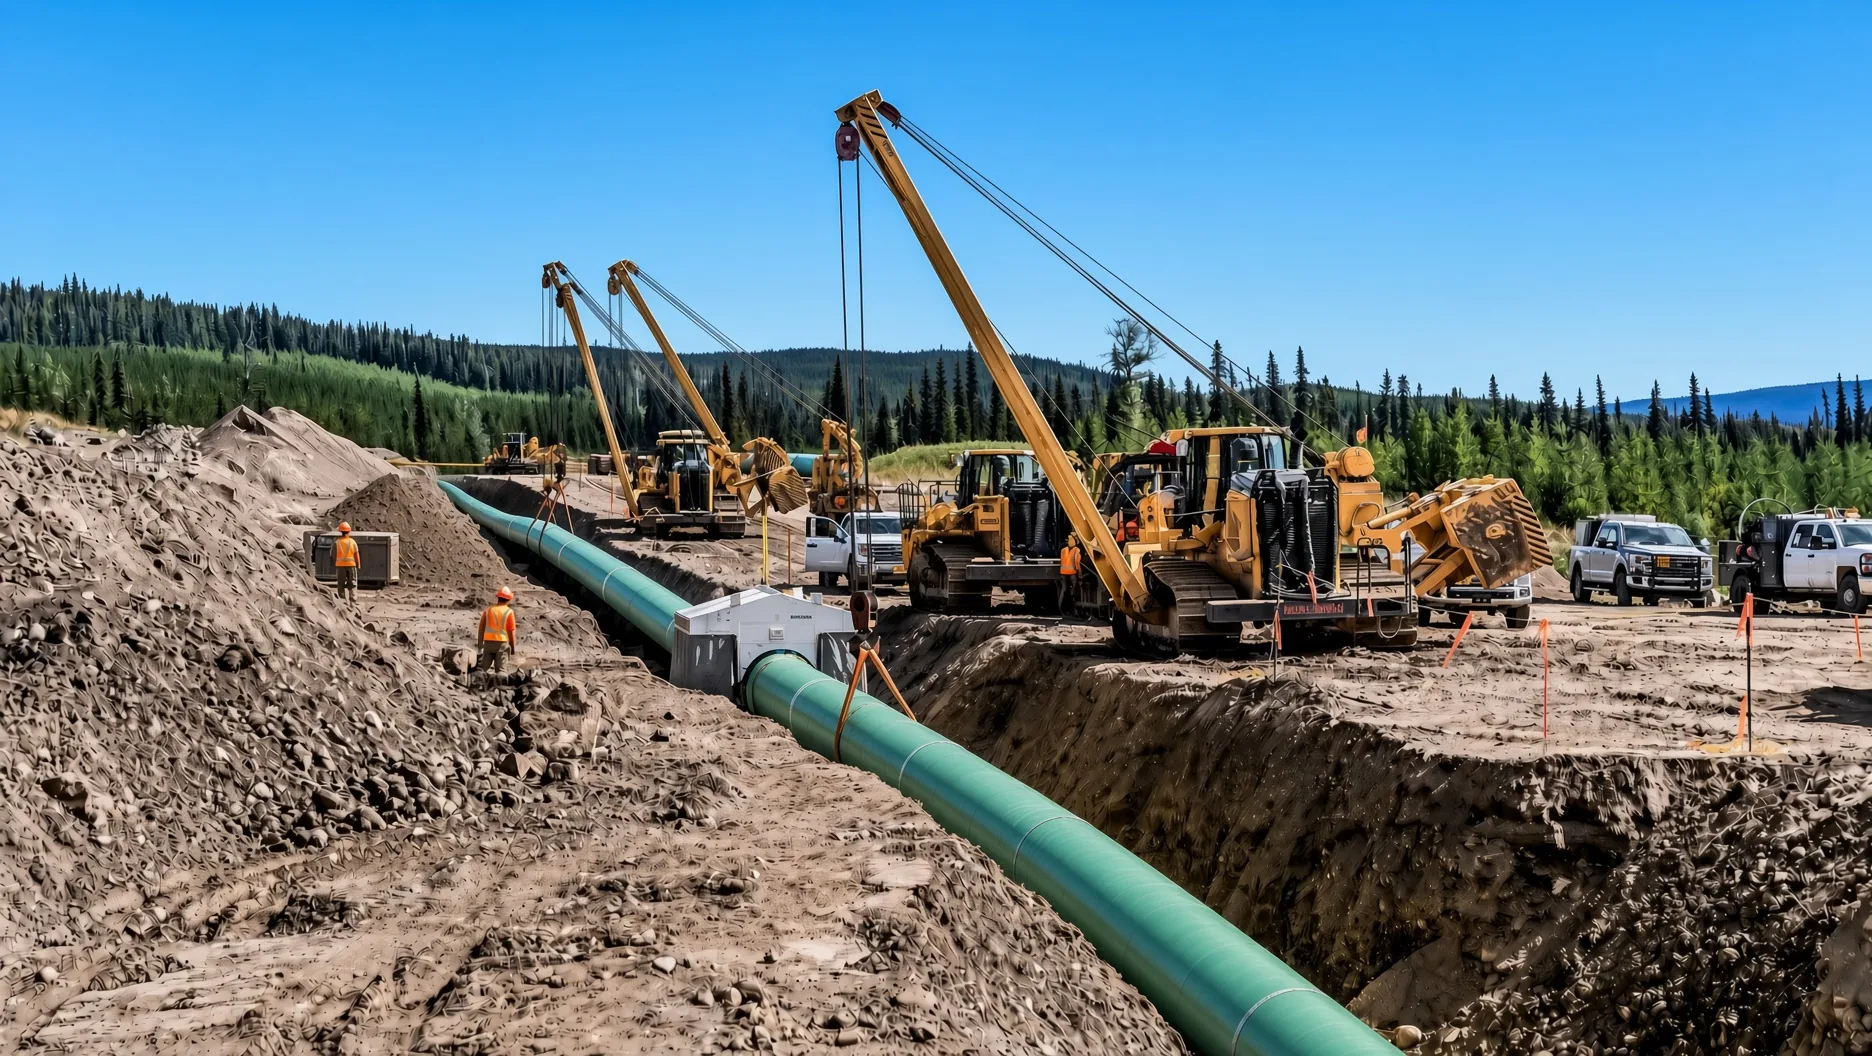
Build capacity, physical and entrepreneurial — whether Canada can still deliver the things a growing nation needs. On the physical side we track whether major infrastructure, from rail to pipelines, gets built on time and at costs competitive with international peers. On the entrepreneurial side we ask whether new companies are being founded and funded here, or whether the founders and capital that should compound at home are flowing elsewhere.
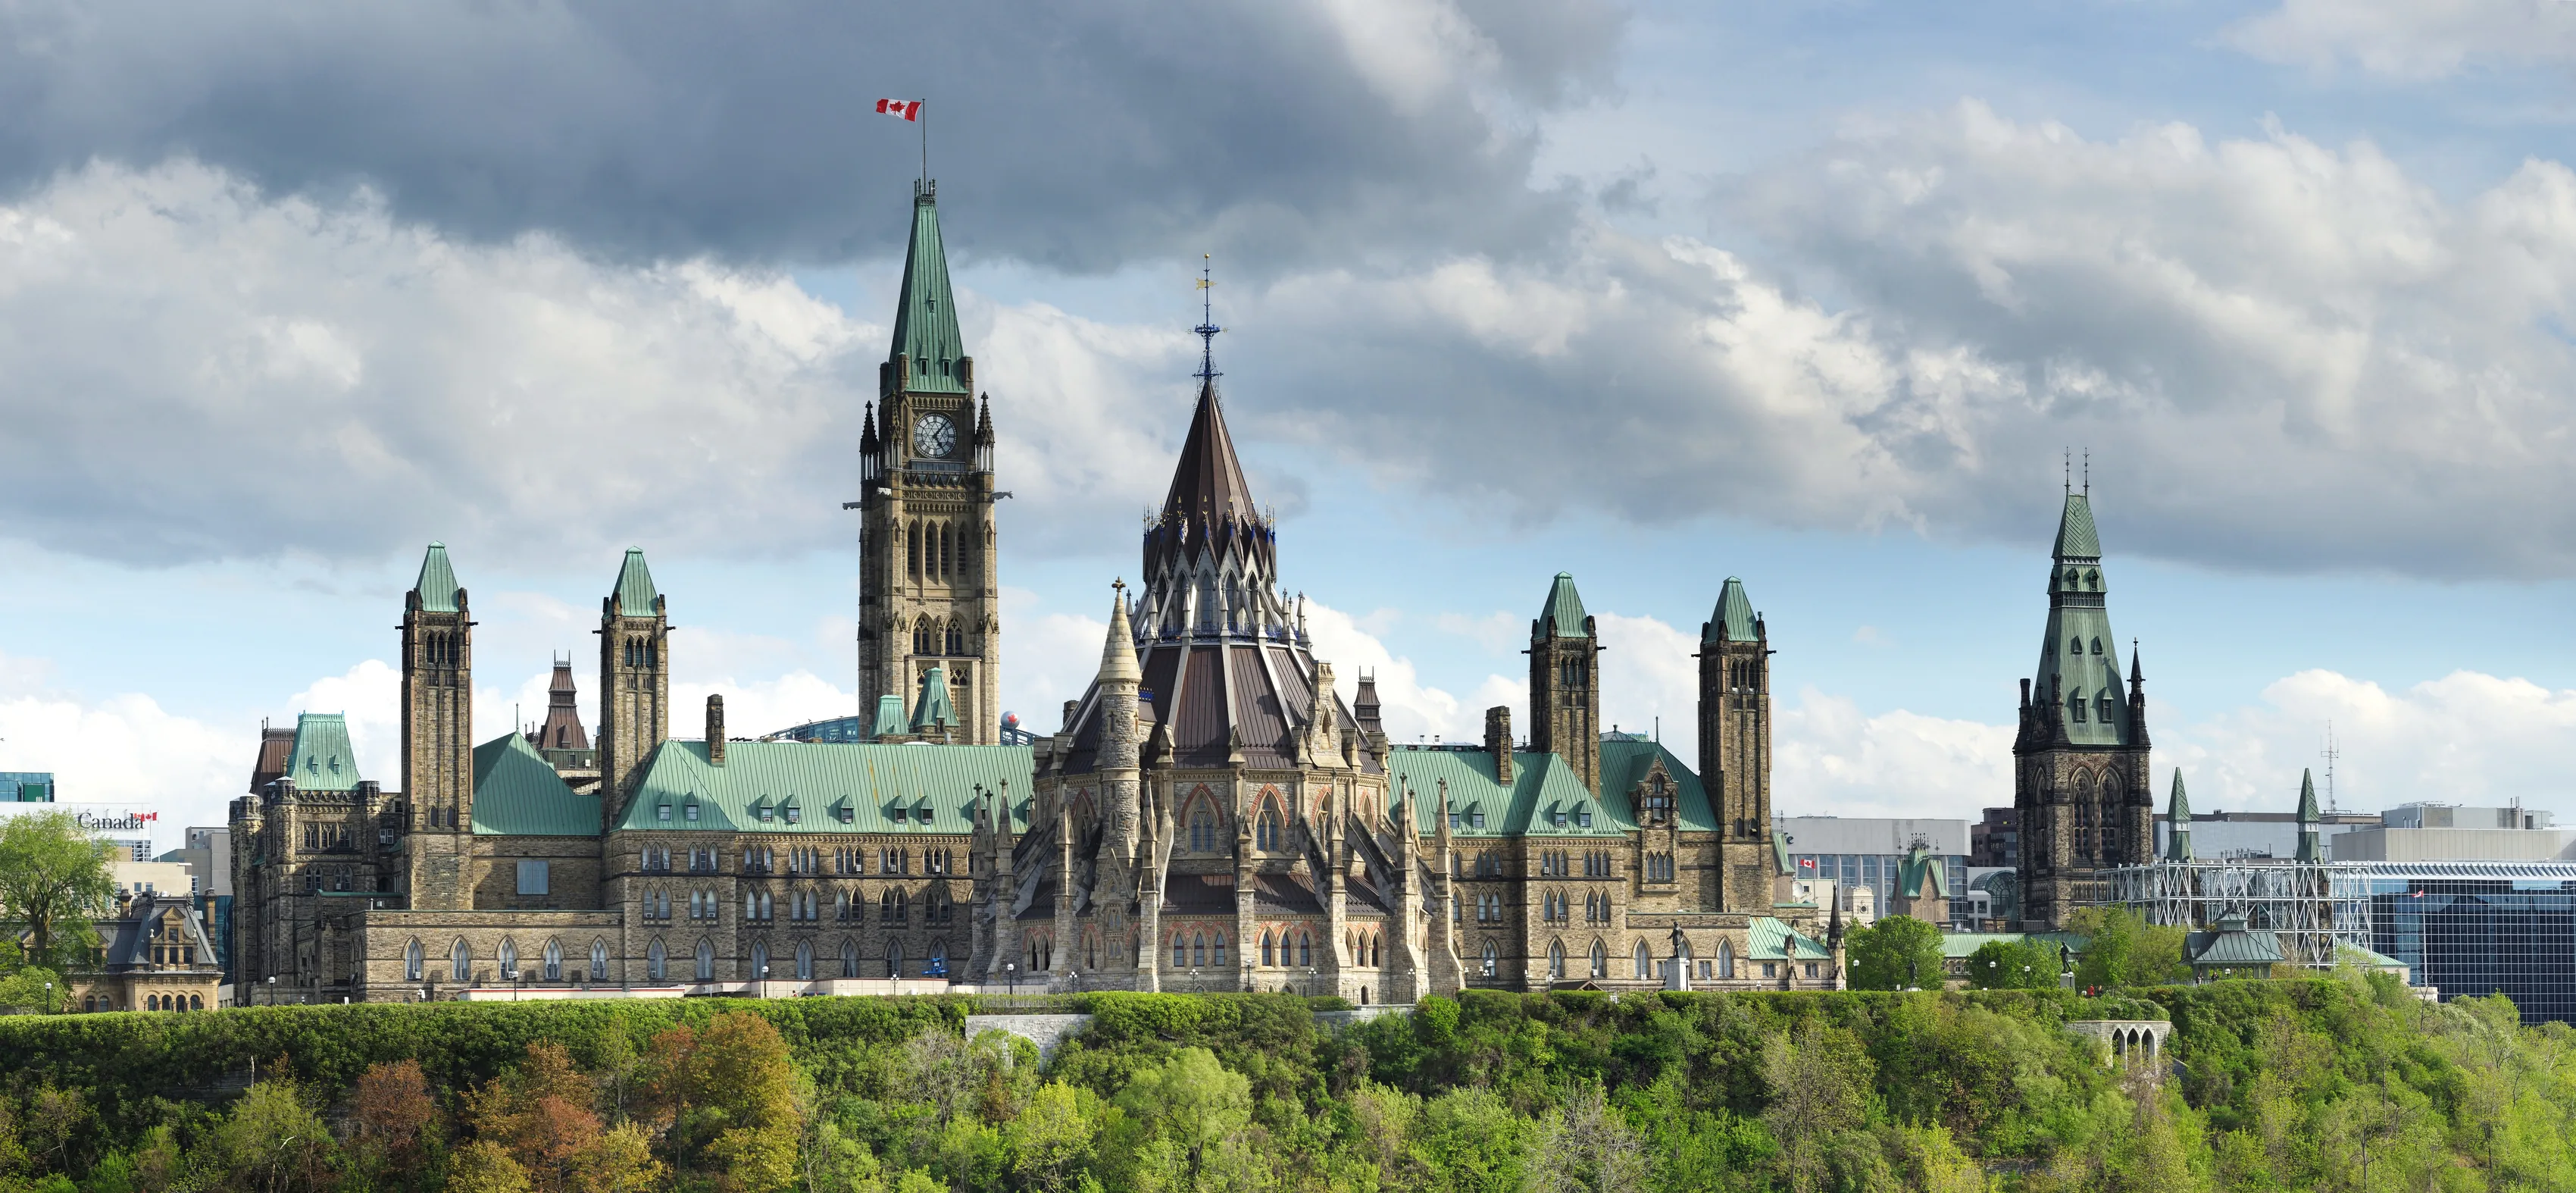
Governing the Nation

Does government deliver?

Administrative state capacity — the machinery of governance and how well it actually serves the people who pay for it. The test is not how much the state spends or how many people it employs, but whether citizens can reach it, get an answer, and receive the service they are owed in reasonable time. We weigh frontline responsiveness, from tax lines to hospital queues, against the cost and growth of the apparatus delivering it.
Securing the Nation

Can we defend ourselves?

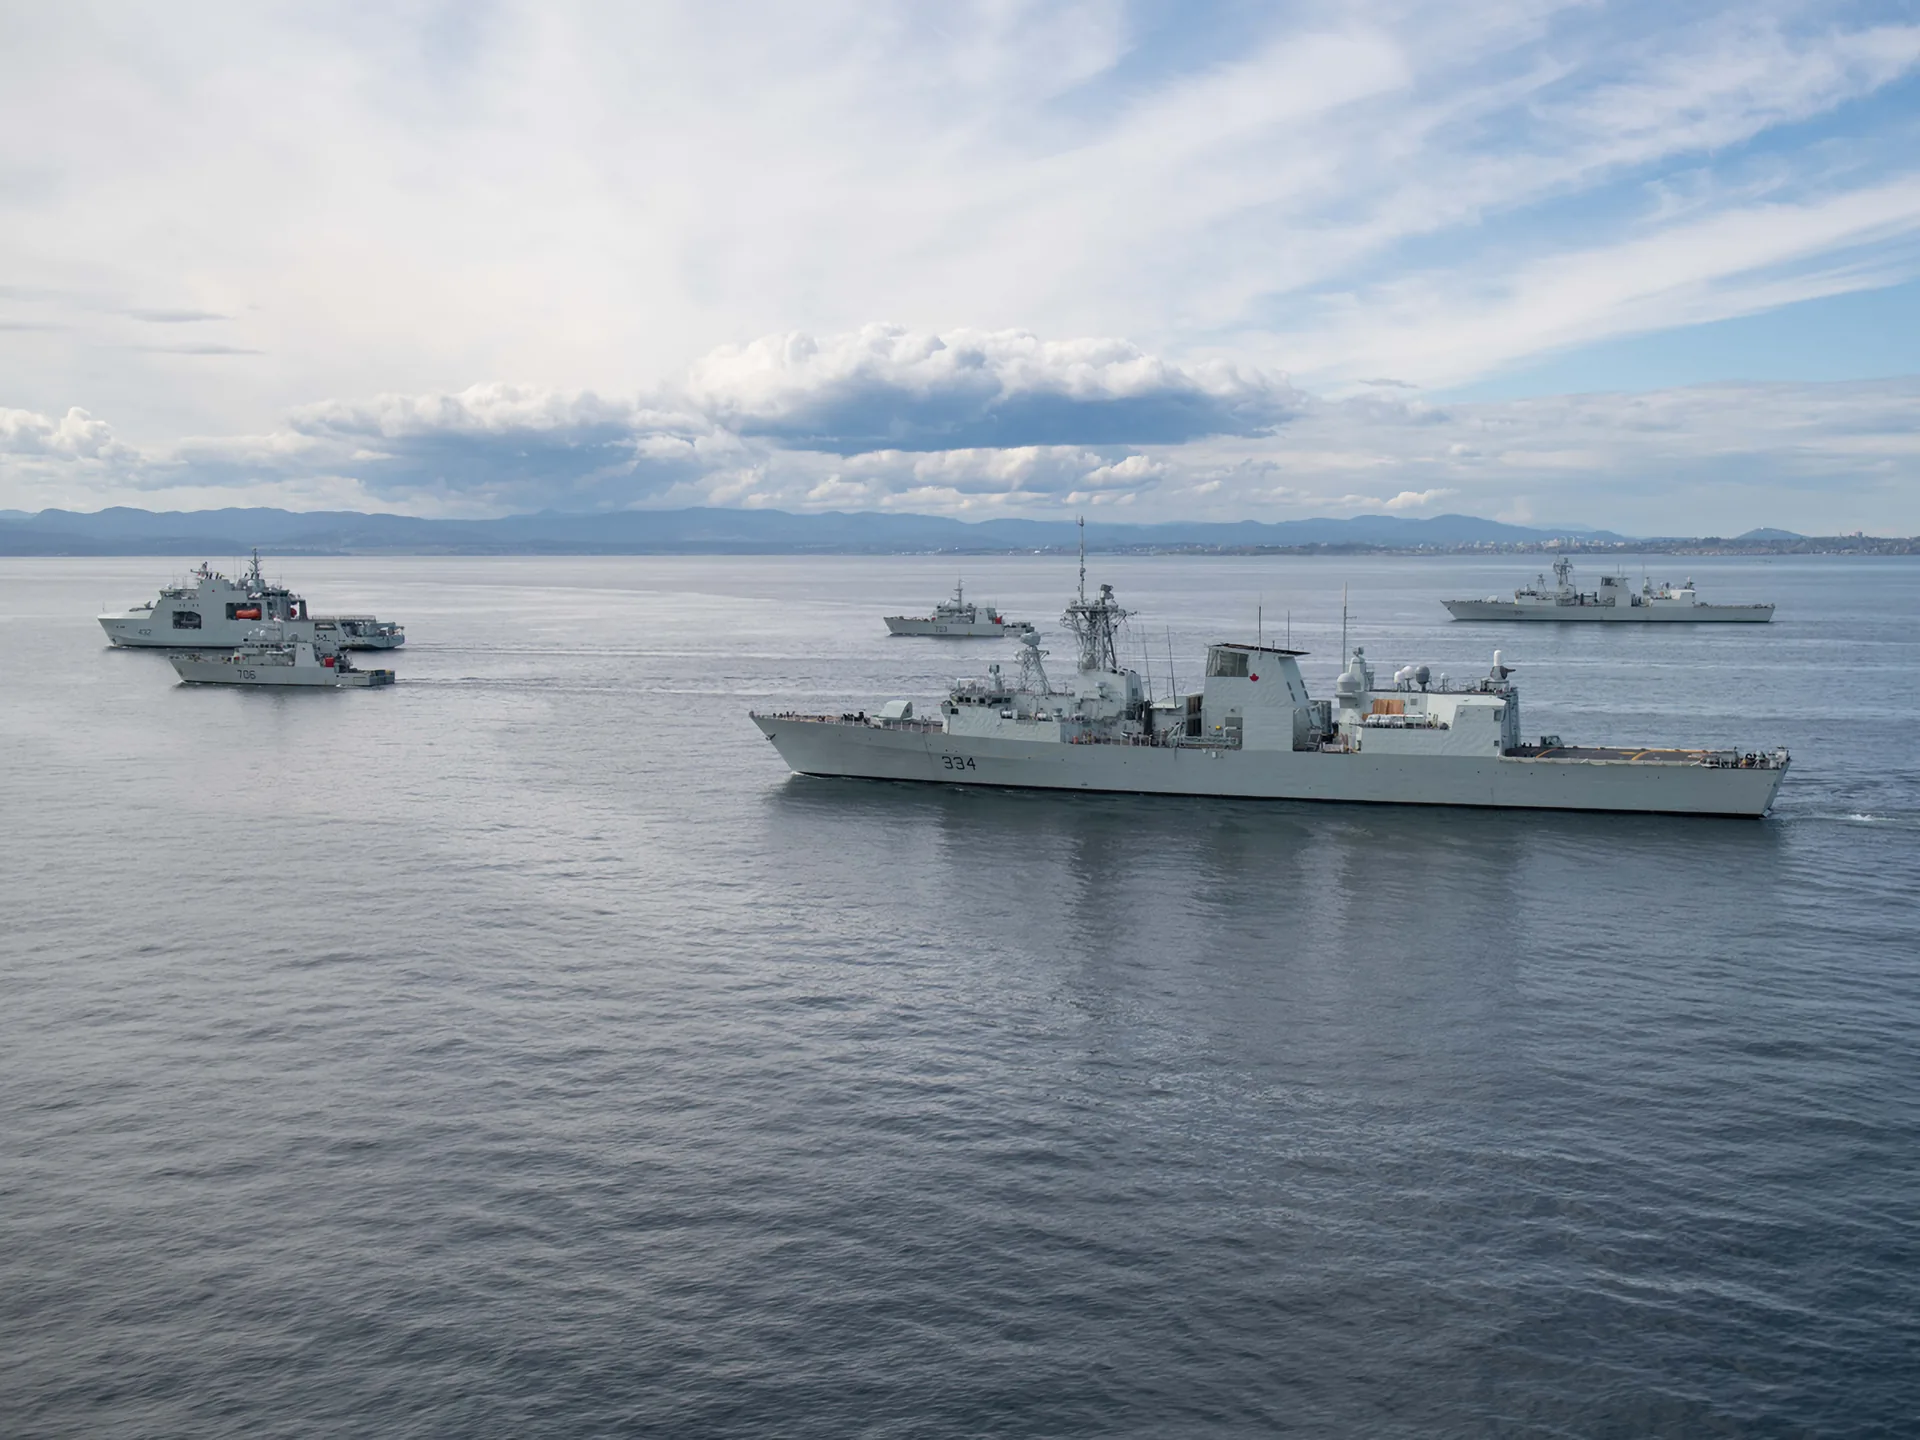
Defence and security capacity — whether Canada invests enough to protect its territory, people and interests, and to hold up its end of the alliances that underwrite that security. Security is read broadly here: alongside traditional military strength, it weighs non-traditional threats such as the integrity of the financial system against money laundering and resilience to cyber attack.

Elevating the Nation

Are our citizens flourishing?

Lived outcomes — whether the citizenry is genuinely flourishing, which is the result that financing, building, governing and securing all exist to produce. Where the other pillars measure inputs and capacity, this one measures the dividend: are incomes rising, can people afford food and shelter, and do they live free of fear. We read these as the bottom line against which every other effort is ultimately judged.